SQL Server / Index Usage Report Project
Posted by Barac in Index Usage Report Project, SQL Monitoring, SQL Server on Oct 5th, 2017 | 0 commentsIndex Usage Report Project
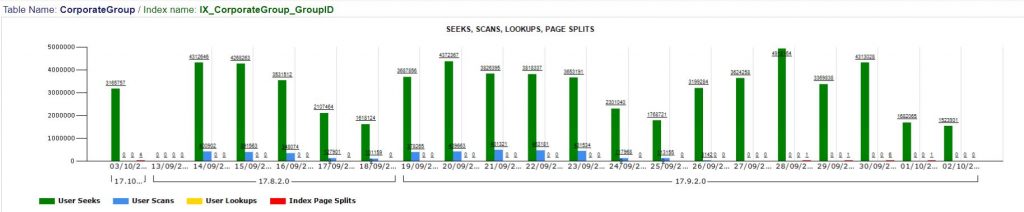
The general project idea was to create the report about every index usage within DB. To be able to see a daily number of scans, seeks, page splits for all indexes or key lookups for clustered. You also can change the date range to see how this index behaved in past.
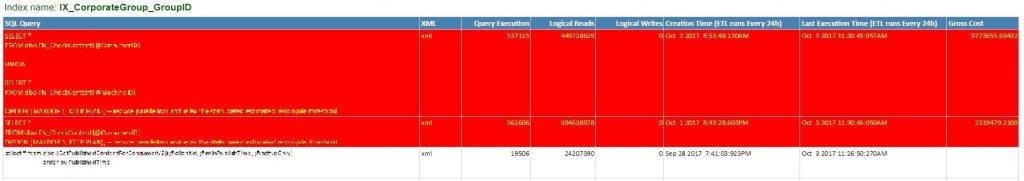
Also, to be able to see all expensive queries using that index (red one are expensive).
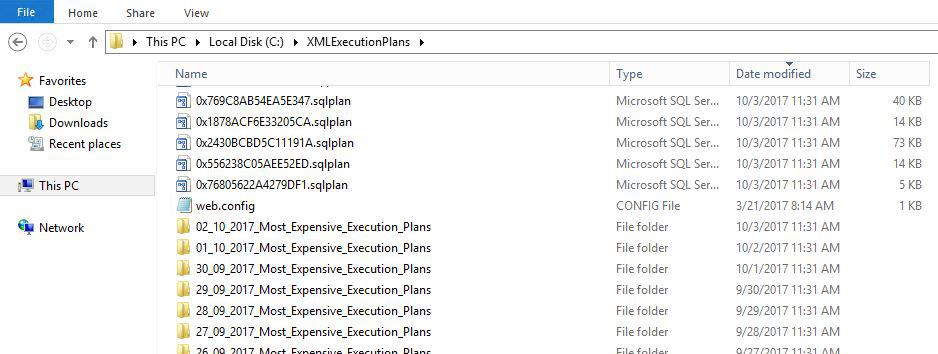
To see and save their execution plans as well.

Project concept
Index Usage Stats
system views
[sys].[indexes] – Basic index information (name, type, etc)
[sys].[objects] – Basic objects information
[sys].[dm_db_index_usage_stats] – for user_seeks, user_scans, user_lookups, user_updates
table-valued function
[sys].[dm_db_index_operational_stats] – for leaf_insert_count, leaf_update_count, leaf_delete_count, leaf_allocation_count or page splits
Index Physical Stats
system views
[sys].[indexes],[sys].[objects] – for avg_fragmentation_in_percent, IndexSizeInKB, fill_factor ets
Execution Plan Cache
system views
[sys].[dm_exec_query_stats] – for plan_handle, query_hash, execution_count, total_logical_reads, total_logical_writes, creation_time, last_execution_time, etc
table-valued function
[sys].[dm_exec_text_query_plan] – for query_plan
[sys].[dm_exec_sql_text] – query_plan converting to text
Most Expensive Queries
system views
[sys].[dm_exec_query_stats] – for plan_handle, query_hash etc
table-valued function
[sys].[dm_exec_text_query_plan] – for query_plan
derived table
query_plan.nodes – for XML
Through a couple of different future posts, I will try to explain steps I did to finish this report, all from ETL processes, SSRS reports and system views I used.
Use case example:
Server: SQL Server 2012 Web Edition, 64GB, CPU 4 Cores
After an application upgrade on one of our clouds, I noticed CPU usage was really high
Immediately after upgrade one of the stored procedures (lots of executions) used wrong more expensive execution plan. With two key lookups on the big table causing lots of logical reads and wrong estimates(view and poor statistics).
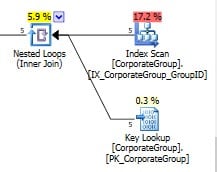
As you can see from the picture below, this nonclustered index did not cover all query predicates and we have key lookup operator on clustered index, and of course nested loops as a join.
After tuning a query structure a got clustered index seek and much faster query with the low number of logical reads. You can see CPU drop on the following picture.
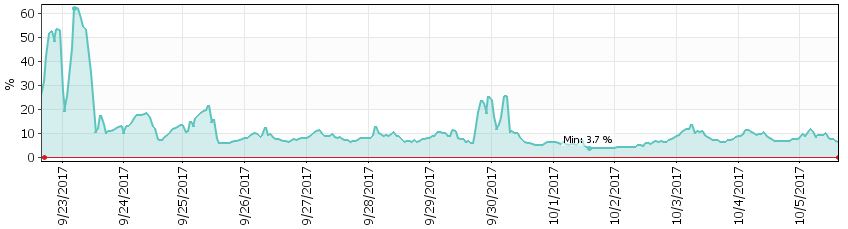
And CPU drop happened at the same time (23/Sept) when execution plan of that SP stopped using that nonclustered index for scanning the table. You can see that on the usage report (picture below). There is one day delay due to ETL process scheduled time for WH database update.
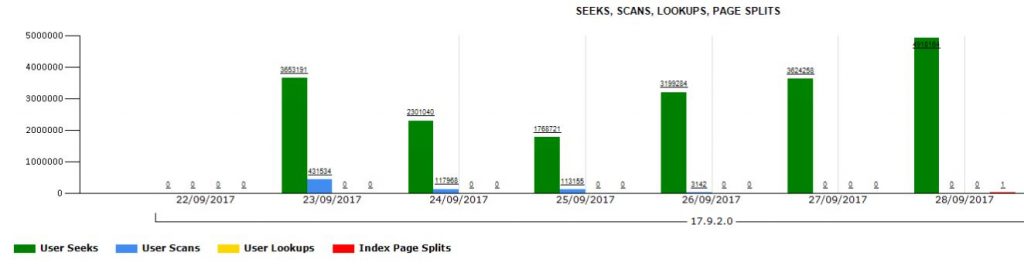
At the end of the day, I was able to show what actually caused this CPU jump. I realize there is a lot of different ways to present this one or similar issues, and this is just one of them …
Index Usage Report Video presentation:
You can see the short video here
Similar Posts:
- SQL Server / Query Optimization / Merge Join Operator / Sort Operator
- SQL Server / Query Optimization / String functions in the WHERE clause and bad estimates
- SQL Server / Index Usage Report Project / Most Expensive Queries
- SQL Server / Query Optimization / TempDB Page Splits / Table Spool (Lazy Spool)
- SQL Server / Long Running Queries / Email Alert

About Me

My name is Zoran, currently living in Auckland, New Zealand. I am a data specialist with more than 15 years of hands-on experience in database administration and optimisation. I am also, Certified Microsoft Trainer (MCT) and Microsoft Certified Solutions Expert (MCSE) with a Master‘s degree in Information Technology. Sharing knowledge and contributing to the SQL Server community is my passion. I am also an organiser of the Auckland SQL User Meetup Group. As well I am active blogger and speaker at different SQL events such as SQL Saturdays, Meetups etc.
read moreAuckland SQL Group


MSDN PROFILE
 SQL SERVER UPDATES
- Microsoft SQL Server 2022 Updates / Release Candidate (RC 1) Evaluation Edition (16.0.950.9)
- Microsoft SQL Server 2019 Updates / BETA (15.0.1000.34) / RTM (15.0.2000.5)
- Microsoft SQL Server 2017 Updates / RTM (14.0.1000.169)
- Microsoft SQL Server 2016 Updates / RTM (13.0.1601.5) / SP1 (13.0.4001.0 or 13.1.4001.0) / SP2 (13.0.5026.0 or 13.2.5026.0) / SP3 (13.0.6300.2 or 13.3.6300.2)
- Microsoft SQL Server 2014 Updates / RTM (12.0.2000.0) / SP1 (12.0.4100.1 or 12.1.4100.1) / SP2 (12.0.5000.0 or 12.2.5000.0) / SP3 (12.0.6024.0 or 12.3.6024.0)
- Microsoft SQL Server 2012 Updates / RTM (11.00.2100) / SP1 (11.0.3000.0 or 11.1.3000.0) / SP2 (11.0.5058.0 or 11.2.5058.0) / SP3 (11.0.6020.0 or 11.3.6020.0) / SP4 (11.0.7001.0 or 11.4.7001.0)
Leave a Reply