SQL Server / Query Optimization / TempDB Page Splits / Table Spool (Lazy Spool)
Posted by Barac in SQL Monitoring, SQL Server on Jun 24th, 2018 | 0 commentsRecently I had a customer with a really slow query execution and a case of large page splits number on the temporary database. In this example, I tried to replicate the similar issue on my local SQL instance using StackOverflow database.
You can download this StackOverflow DB from Brent Ozar web page, just follow the instructions
How to Download the Stack Overflow Database via BitTorrent
Firstly I created an Extended Event session to follow up if the page splits occur.
To be sure that we are checking right database we can query sys.databases system view for database id
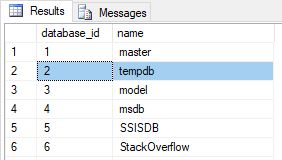
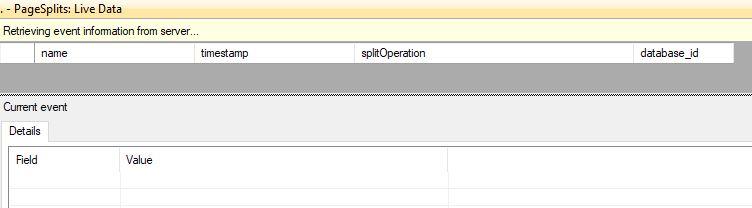
Currently, there are no page splits ongoing on my test server
I will run the following query with join on two tables on multiple columns with OR condition
Lets check page splits again
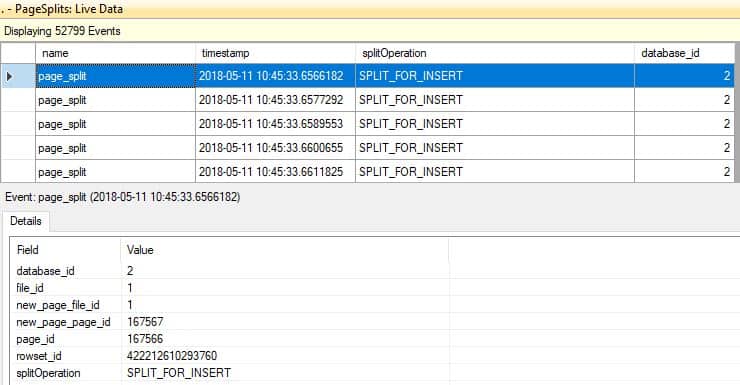
We have more than 50K page splits in less than a minute.
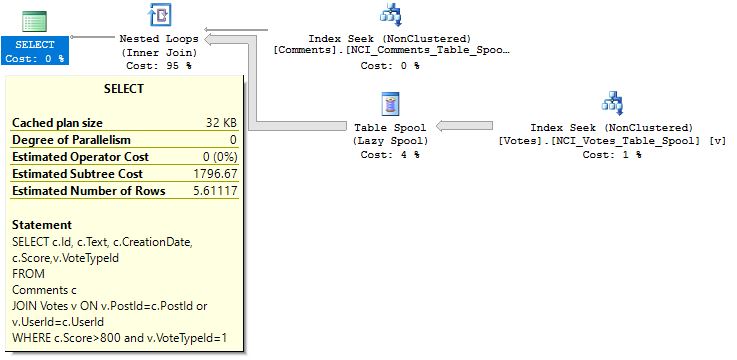
Here is the execution plan for that query
I have two nonclustered indexes covering Comments and Votes tables
Table Comments
Non-Clustered index NCI_Comments_Table_Spool
Table Votes
Non-Clustered index NCI_Votes_Table_Spool
IO statistics for that query:
(7 row(s) affected)
Table ‘Votes’. Scan count 1, logical reads 22100, physical reads 0, read-ahead reads 0, lob logical reads 0, lob physical reads 0, lob read-ahead reads 0.
Table ‘Worktable’. Scan count 1, logical reads 24675832, physical reads 0, read-ahead reads 0, lob logical reads 0, lob physical reads 0, lob read-ahead reads 0.
Table ‘Comments’. Scan count 1, logical reads 6, physical reads 0, read-ahead reads 0, lob logical reads 0, lob physical reads 0, lob read-ahead reads 0.
I am usually using statistics parser web page to read IO statistics.

We can see that we have 24 million logical reads within worktable.
I will use SQL Sentry Plan Explorer to examine Plan Tree of this execution plan more detailed.

Table Spool (Lazy Spool) operator creates a temporary table and stores the rows in this table only when the parent operator actually asks for a row (Non-blocking operator). Since Table Spool operator creates such a big table within our Temporary database it causing page splits.
Let’s check our execution plan more detailed.
We have a non-clustered index seek on table Votes returning little bit above 8 million rows.
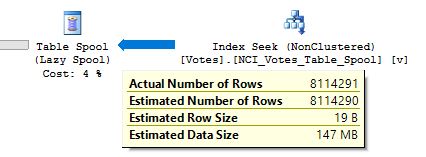
Also, we have Table Spool operator which needs to create a temporary table for those 8 million rows.
You can see the difference between the estimated number of rows and actual.
Let’s see more details about Spool Table operator

You can see that we have 1 rebind and 11 rewinds on the table spool operator.
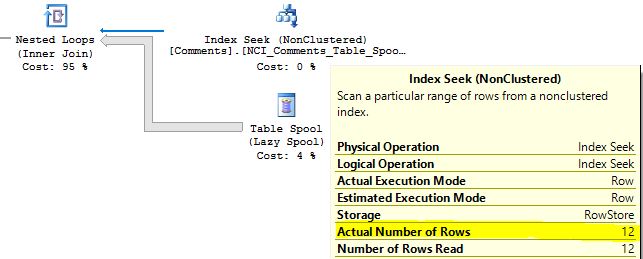
We have our spool operator on the inner side of a loop join, that means the sum of the number of rebinds and rewinds should be equal the number of rows processed on the outer side of the join in our case that is 12.
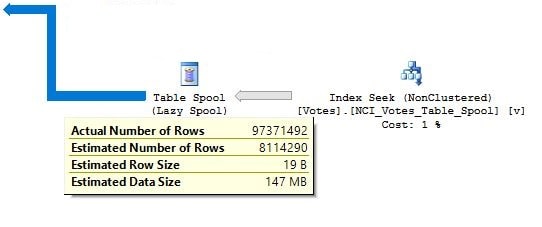
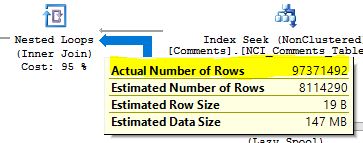
A rebind means that one or more of the correlated parameters of the join changed and the inner side must be reevaluated. A rewind means that none of the correlated parameters changed and the prior inner result set may be reused, in our case 1+11. From 8 million rows we end up with almost 100 million. 1 Rebinds (8114290) + 11 Rewinds (89257190) + 12 rows from outer side of join=97371492
I am trying to keep this numbers of rebinds and rewinds as low as possible since they can cause more disk I/O.
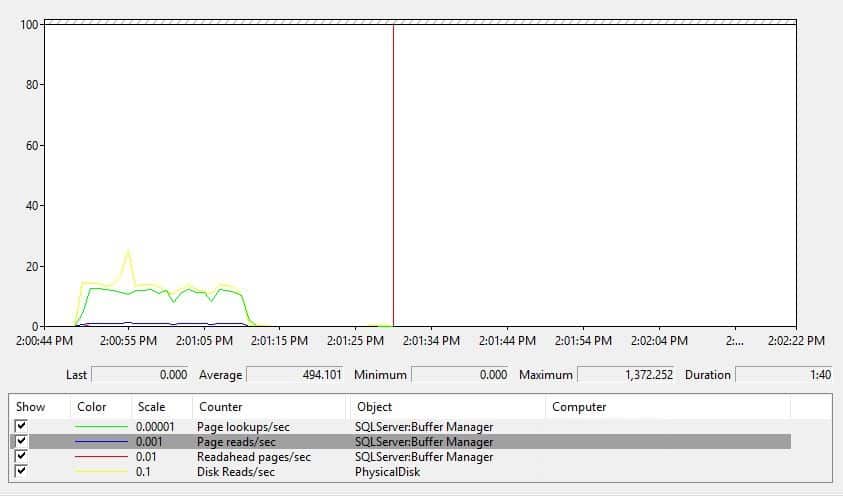
Besides page splits on temporary database Table Spool operator may cause high number page lookups, page reads, disk I/O, so let’s see this in an example. You can see those values using “SET STATISTICS IO ON” but let’s get them using performance monitor.
Let’s run the same query again and monitor performance. I will use DBCC DROPCLEANBUFFERS to test queries with a cold buffer cache (Do not use this on production).
And I will use the following counters from performance monitor tool.
SQL Server Buffer Manager:
Page reads/sec – Number of physical database page reads issued.
Page lookups/sec – Number of requests to find a page in the buffer pool.
Readahead pages/sec – Number of pages read in anticipation of use.
Physical Disk:
Disk Reads/sec – Rate of read operations on the disk.
Statistics IO results are
(7 row(s) affected)
Table ‘Votes’. Scan count 1, logical reads 22100, physical reads 2, read-ahead reads 22098, lob logical reads 0, lob physical reads 0, lob read-ahead reads 0.
Table ‘Worktable’. Scan count 1, logical reads 24675832, physical reads 0, read-ahead reads 0, lob logical reads 0, lob physical reads 0, lob read-ahead reads 0.
Table ‘Comments’. Scan count 1, logical reads 6, physical reads 3, read-ahead reads 2, lob logical reads 0, lob physical reads 0, lob read-ahead reads 0.
Performance monitor
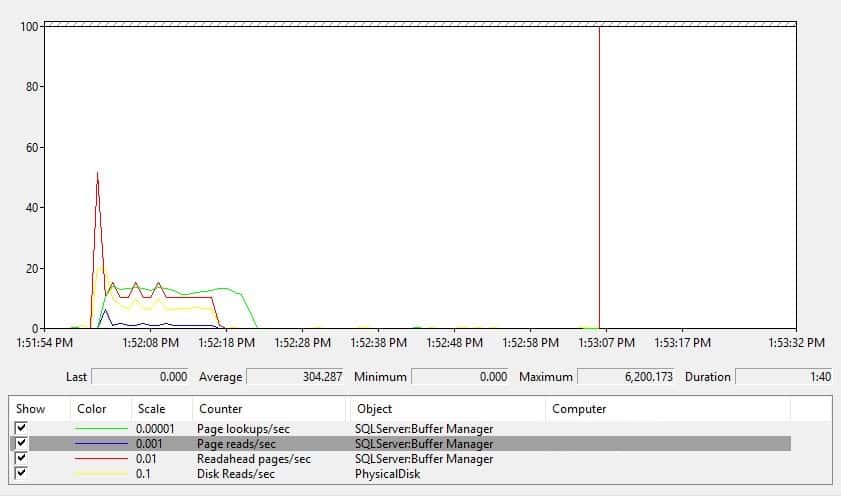
We have lots of logical reads, physical reads and read-ahead reads. Read-Ahead Reads shows the number of read pages in a buffer before getting the request from the query (Default is enabled). If we disable this our performance will be even worse.
(7 row(s) affected)
Table ‘Votes’. Scan count 1, logical reads 22053, physical reads 2759, read-ahead reads 0, lob logical reads 0, lob physical reads 0, lob read-ahead reads 0.
Table ‘Worktable’. Scan count 1, logical reads 24675832, physical reads 0, read-ahead reads 0, lob logical reads 0, lob physical reads 0, lob read-ahead reads 0.
Table ‘Comments’. Scan count 1, logical reads 5, physical reads 4, read-ahead reads 0, lob logical reads 0, lob physical reads 0, lob read-ahead reads 0.
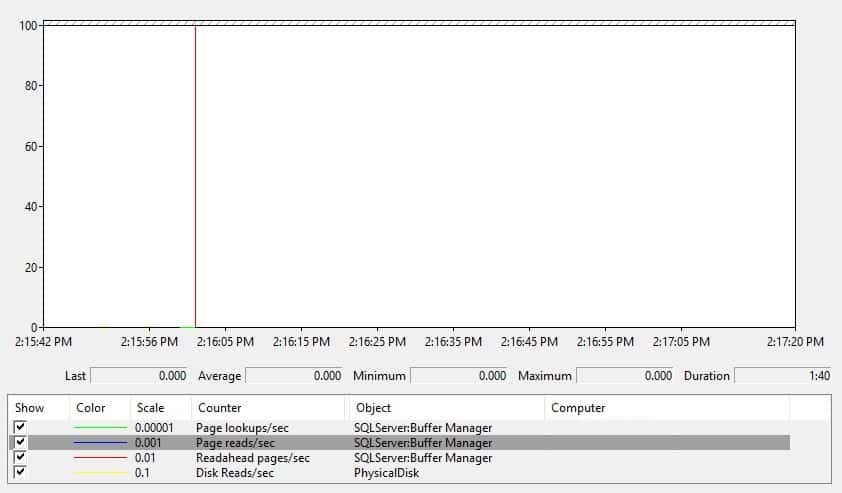
Let’s change this query logic a bit and try to use UNION ALL or UNION instead of using join on those two tables on multiple columns with OR condition
(7 row(s) affected)
Table ‘Votes’. Scan count 24, logical reads 144, physical reads 0, read-ahead reads 0, lob logical reads 0, lob physical reads 0, lob read-ahead reads 0.
Table ‘Comments’. Scan count 2, logical reads 12, physical reads 0, read-ahead reads 0, lob logical reads 0, lob physical reads 0, lob read-ahead reads 0.
If we compare those results you can see that now we have less logical reads than before, as well there are no physical reads anymore.
I also should mention that I created two new non-clustered indexes to cover the Votes table. You always can consider using a non-clustered filtered index as well, if you have a well-defined subset of data.
Through this example, I just wanted to show an influence of the spool operator on the query execution time.
I am not suggesting that Spool operator always have the bad influence on your query execution time.
That mainly depends on query structure and what data you try to retrieve. Spool operator simple store your data in the temp table so that data can be reused again.
Similar Posts:
- SQL Server / Query Optimization / Merge Join Operator / Sort Operator
- SQL Server / Query Optimization / String functions in the WHERE clause and bad estimates
- SQL Server / Query Optimization / Memory Grant Warning / Excessive Grant
- SQL Server / Index Usage Report Project
- SQL Server / ALTER INDEX / CREATE INDEX Progress

About Me

My name is Zoran, currently living in Auckland, New Zealand. I am a data specialist with more than 15 years of hands-on experience in database administration and optimisation. I am also, Certified Microsoft Trainer (MCT) and Microsoft Certified Solutions Expert (MCSE) with a Master‘s degree in Information Technology. Sharing knowledge and contributing to the SQL Server community is my passion. I am also an organiser of the Auckland SQL User Meetup Group. As well I am active blogger and speaker at different SQL events such as SQL Saturdays, Meetups etc.
read moreAuckland SQL Group


MSDN PROFILE
 SQL SERVER UPDATES
- Microsoft SQL Server 2022 Updates / Release Candidate (RC 1) Evaluation Edition (16.0.950.9)
- Microsoft SQL Server 2019 Updates / BETA (15.0.1000.34) / RTM (15.0.2000.5)
- Microsoft SQL Server 2017 Updates / RTM (14.0.1000.169)
- Microsoft SQL Server 2016 Updates / RTM (13.0.1601.5) / SP1 (13.0.4001.0 or 13.1.4001.0) / SP2 (13.0.5026.0 or 13.2.5026.0) / SP3 (13.0.6300.2 or 13.3.6300.2)
- Microsoft SQL Server 2014 Updates / RTM (12.0.2000.0) / SP1 (12.0.4100.1 or 12.1.4100.1) / SP2 (12.0.5000.0 or 12.2.5000.0) / SP3 (12.0.6024.0 or 12.3.6024.0)
- Microsoft SQL Server 2012 Updates / RTM (11.00.2100) / SP1 (11.0.3000.0 or 11.1.3000.0) / SP2 (11.0.5058.0 or 11.2.5058.0) / SP3 (11.0.6020.0 or 11.3.6020.0) / SP4 (11.0.7001.0 or 11.4.7001.0)
Leave a Reply