SQL Server / Monitoring / SSMS Activity Monitor and Page Splits per Second on TempDB
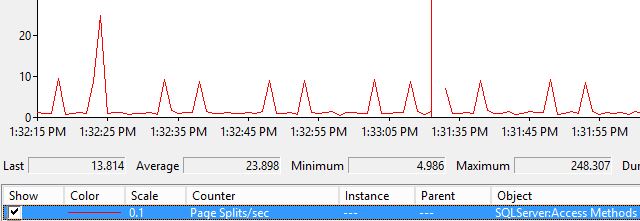
Posted by Barac in SQL Monitoring, SQL Server on Nov 18th, 2017 | 0 commentsOn one of our older instances I noticed unusually high number of page splits per second, nothing spectacular, average around 20+ (normally below 5) just something unusual for that period of time.

Same period of time day before

I was curious and wanted to investigate what is causing this additional page splits. I did not noticed any performance issues. As well I checked the indexes of all user databases and there where no additional page splits.
SQL Server provides a DMV to track page splits sys.dm_db_index_operationl_stats. You can use per table or for the whole DB.
Usually I am using my SSRS report to follow up all index usage changes daily.
Example

So I run sp_who2 to see all the sessions that are currently established in the database.
I noticed unusually high CPU usage and IO usage on tempdb. So I suspected that some SSMS background activity causing this, such as Activity Monitor usage. To be able to see that I needed to relate session ID with temp table creation event.
So I created Extended Event to accomplish that. You can read more about how to do this on this great post “who owns that #temp table”, from Aaron Bertrand.
The following session definition will capture all #temp table creation events
To analyze data I used following query against the .xel file
I noticed there are two Activity Monitor sessions opened from two different host, and this is the results

Example of those SPID with sp_who2 query

After I disconnected all sessions who had Activity Monitor opened my page split per seconds were normal again.

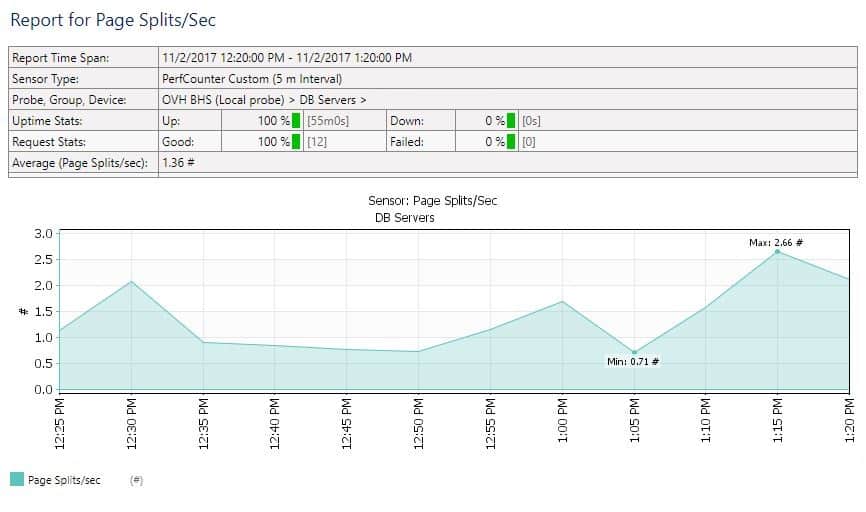
I usually use Performance Monitor (PerfMon) which is Windows Tool to measure page split per/sec (per instance). I pull those counter results to my PRTG sensors (keeps historical values), and results for page splits for the same period of time day after look like this.


Leave a Reply